GOLINE Public NTP Servers
High-precision Network Time Protocol services for IPv4 and IPv6
Europe Zone
Switzerland
Stratum 2
24/7 Monitoring
Primary NTP Server
Hostname
ntp.goline.ch
IPv4
185.54.81.23
IPv6
2a02:4460:1:1::19
Zones
@ch Europe
Stratum 2
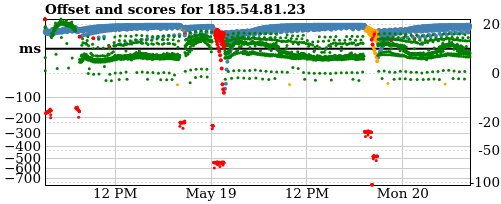
IPv4 Offset Monitoring

Loading real-time data...
IPv6 Offset Monitoring

Loading real-time data...
Secondary NTP Server
Hostname
ntp2.goline.ch
IPv4
185.54.81.25
IPv6
2a02:4460:1:1::20
Zones
@ch Europe
Stratum 2
IPv4 Offset Monitoring

Loading real-time data...
IPv6 Offset Monitoring

Loading real-time data...
Chart Legend
Small dots represent offset measurements in milliseconds (left axis)
Large dots show points/scores for server reliability (right axis)
Note: Y-axes use non-linear scaling to highlight the most relevant data ranges
Quick Setup
Linux/Unix NTP Configuration:
server ntp.goline.ch iburst
server ntp2.goline.ch iburst
server ntp2.goline.ch iburst
Windows Time Service:
w32tm /config /manualpeerlist:"ntp.goline.ch,ntp2.goline.ch" /syncfromflags:manual